Clarity and Data are Important – Issue 71

I am fed up with the COVID-19 debates over mandates and sanitary measures. To find a path forward, agreement on data and clarity are important.
Clarity:
- Different levels of government have different responsibilities. So, in Canada and the US mask mandates, school and office closures, restaurant and bar openings, and most of the things that drive us a bit buggy are the responsibility of local governments. Indeed 90% plus of the things that are bothersome are not the responsibility of either federal government. Same in the UK – Northern Ireland, Scotland, and Wales drive their own agendas.
- Both sides of the political spectrum bear responsibility for political polarization of vaccines and other sanitary measures.
- “Freedom” comes with obligation to look out for one another. Freedom without responsibility is chaos. Nobody considers vaccination mandates and other sanitary measures for their own amusement. They are designed to protect the public at large and may require some individual sacrifice. And, sometimes the authorities get some of the measures wrong.
- Not every jurisdiction has the same capacity to handle extraordinary health events. Hospital beds, health care personnel, and respirators influence healthcare decisions.
- Without a doubt, measures taken by governments around the world over the past two years have saved many lives. But also, there can be no doubt that the same measures have had negative impact as well.
- Decisions have consequences. Denmark has opened up and its case count has soared to 7,369 per 100,000 per day. Canadian jurisdictions have just started to announce reduced sanitary measures but has the lowest number of new cases per capita. So what is the right balance?
The Data:
The Data in the table below comes from Our World in Data. Media outlets and institutions from both sides of the rationale political spectrum use its statistics. Examples:
- Wall Street Journal and the New York Times
- Financial Times and The Guardian
So, it is the best that I could find.
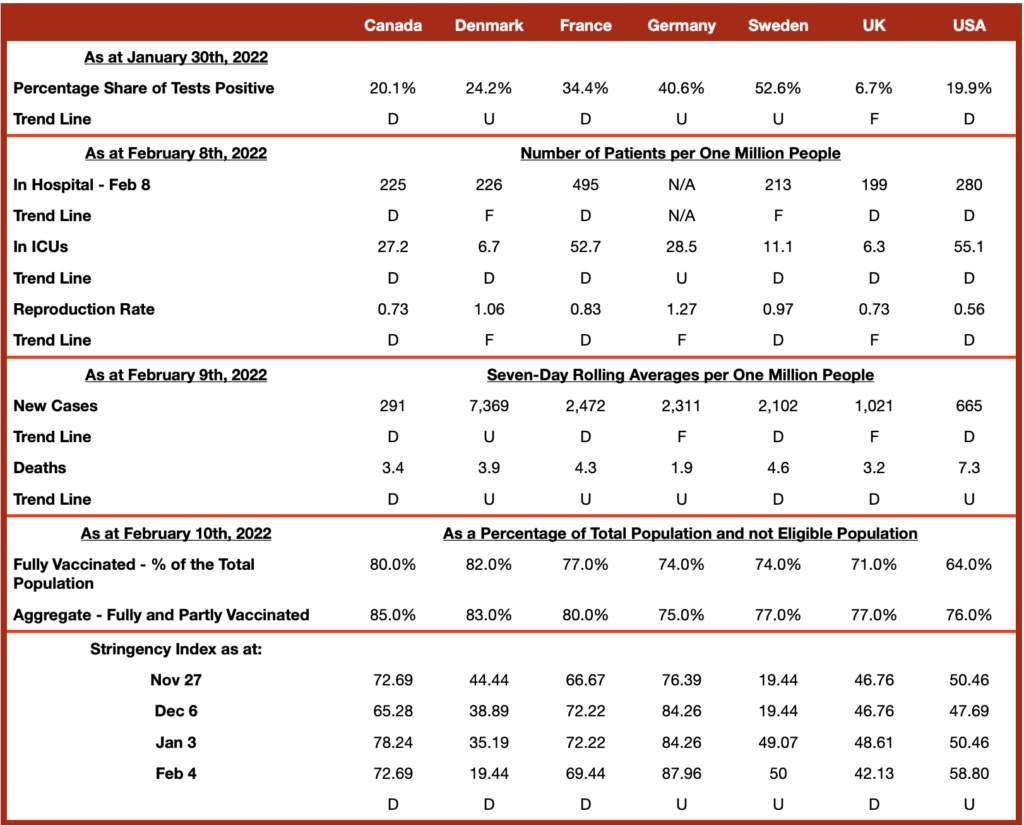
Notes:
- Reproduction rate or “r” rate – represents the average number of new infections caused by a single infected individual. If the rate is greater than 1, the infection is able to spread in the population. If it is below 1, the number of cases occurring in the population will gradually decrease to zero.
- Vaccination rates are as a percentage of the total population, not the eligible population. Percentages of eligible population vaccinated would be higher.
- Stringency Index – a composite measure of nine “sanitary” measures such as school and work closures, travel bans, mask mandates, etcetera
- The dates vary marginally from one category to the other as some data aggregation takes more time.Therefore, I have chosen dates on which my seven sample nations are reporting.
- Trend lines – “u” is up; “d” is down; “f” is flat
The data presented comes from Our World in Data, a project of the Global Change Data Lab: Mathieu, E., Ritchie, H., Ortiz-Ospina, E. et al. A global database of COVID-19 vaccinations. Nat Hum Behav (2021)
Other Data
From the New York Times:
There were 7.8 deaths per 100,000 unvaccinated people. On the other hand, that number dropped to 0.6 for the vaccinated and .1 % of the vaccinated with a booster. If you are unvaccinated your risk of death is 78 times greater than mine. Not a meaningless number.
From the Québec web site:
The risk of hospitalization for the inadequately vaccinated is 7.4 times greater versus the vaccinated. And, it is 14.1 times more likely that the inadequately vaccinated will end up in intensive care.
Pretending that Covid has disappeared has costs, to people’s livelihoods, happiness and physical well-being. And allowing Covid to continue dominating everyday life has costs, to people’s livelihoods, happiness and physical well-being. The only realistic option is to balance the two and look for a path that minimizes the human damage.
David Leonhardt, The New York Times, The Morning, February 1, 2022
So What Does the Data Tell You?
Go to the Our World in Data web site and play with the data and choose different countries. What the data tells me:
- National, regional governments, and individual citizens have to make choices.
- Those choices have to find an acceptable balance between sickness / death and mental health / COVID fatigue
- In the US, low vaccination rates and a middle of the road stringency index contribute to the highest death rate among the countries reviewed.
- Denmark has radically reduced sanitary measures leading to significant spike in new cases. Usually hospitalizations and deaths are trailing indicators.
- Canada is ready for the various reductions in sanitary measures announced.
- Vaccines work.
So what decisions would you have made? Clarity and data are important.
And I have to Say:
This was so boring to write but I had to do it. I am moving on now. No more!!! I am always speaking to the deaf:
- Those who just want to get back to normal and discard most if not all sanitary measures.
- Those who do not want to entertain the thought that COVID-19 is not going to go away and that we need to learn to live with it.
- And then there are some people who wear masks when outside or in their car alone. They live in absolute fear of the disease.
- Plus the selfish whose personal freedom is more important than caring about people that die from cancer on hospital waiting lists or infecting their grandmothers.
So why do I bother?